Multiple Choice
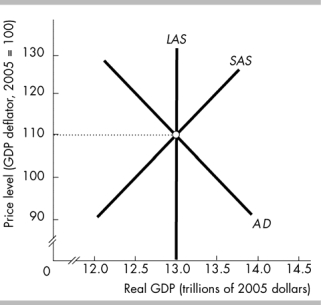
-The above figure illustrates
A) an inflationary gap.
B) a full-employment equilibrium.
C) a recessionary gap.
D) an equilibrium at the economyʹs physical limits.
Correct Answer:

Verified
Correct Answer:
Verified
Q274: A change in _results in a movement
Q275: The short-run aggregate supply curve is upward
Q276: A change in_ creates a movement along
Q277: <img src="https://d2lvgg3v3hfg70.cloudfront.net/TB6802/.jpg" alt=" -In the above
Q278: When the labor market is int full
Q280: Which of the following changes while moving
Q281: In the short run, a rightward shift
Q282: <img src="https://d2lvgg3v3hfg70.cloudfront.net/TB6802/.jpg" alt=" -In the above
Q283: <img src="https://d2lvgg3v3hfg70.cloudfront.net/TB6802/.jpg" alt=" -In the above
Q284: In a short-run macroeconomic equilibrium, potential GDP