Multiple Choice
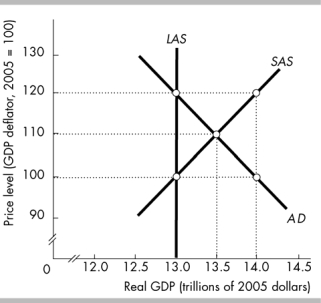
-In the above figure, as the economy adjusts toward equilibrium, the
A) SAS curve will shift leftward.
B) AD curve will shift leftward.
C) SAS curve will shift rightward.
D) AD curve will shift rightward.
Correct Answer:

Verified
Correct Answer:
Verified
Q171: If the money prices of resources changes,
Q303: The Keynesian theory of business cycle views
Q383: The U.S. fiscal policy implemented in 2008
Q384: A change in the money wage rate
Q385: In the long-run<br>A) real GDP is equal
Q387: Aggregate demand increases if the quantity of
Q389: At long-run macroeconomic equilibrium,_ .<br>A) an
Q390: An above full-employment equilibrium occurs when<br>A) the
Q391: A technological advance the long -run aggregate
Q392: <img src="https://d2lvgg3v3hfg70.cloudfront.net/TB6802/.jpg" alt=" -In the above