Multiple Choice
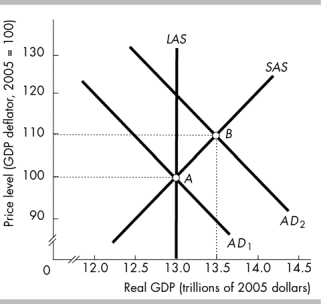
-In the above figure, the aggregate demand curve is AD2, so the short-run equilibrium level of real GDP is
A) $13.5 trillion.
B) more than $13 and less than $13.5 trillion.
C) $13 trillion.
D) None of the above answers is correct.
Correct Answer:

Verified
Correct Answer:
Verified
Q39: <span class="ql-formula" data-value="\begin{array} { | l |
Q40: <span class="ql-formula" data-value="\begin{array} { | l |
Q41: If aggregate demand grows only slightly faster
Q42: <img src="https://d2lvgg3v3hfg70.cloudfront.net/TB6802/.jpg" alt=" -In the above
Q45: The aggregate demand curve illustrates that, as
Q46: A decrease in government transfer payments<br>A) decreases
Q47: When the price level rises, the long-run
Q48: According to the intertemporal substitution effect, a
Q49: When an increase in aggregate demand exceeds
Q200: Wealth and substitution effects explain why the