menu-iconExamlexExamLexServices

Discover

Ask a Question
  1. All Topics
  2. Topic
    Business
  3. Study Set
    Macroeconomics Study Set 41
  4. Exam
    Exam 10: Aggregate Supply and Aggregate Demand
  5. Question
    -In the Above Figure, the Aggregate Demand Curve Is AD<sub>2</sub>
Solved

-In the Above Figure, the Aggregate Demand Curve Is AD2

Question 245

Question 245

Multiple Choice

  -In the above figure, the aggregate demand curve is AD<sub>2</sub>, so the long-run equilibrium level of real GDP is A)  $13.5 trillion. B)  more than $13 and less than $13.5 trillion. C)  $13 trillion. D)  None of the above answers is correct.
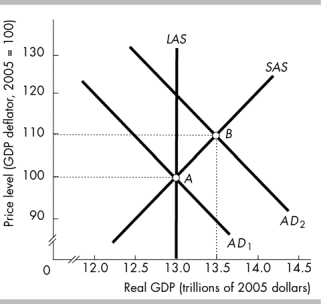
-In the above figure, the aggregate demand curve is AD2, so the long-run equilibrium level of real GDP is


A) $13.5 trillion.
B) more than $13 and less than $13.5 trillion.
C) $13 trillion.
D) None of the above answers is correct.

Correct Answer:

verifed

Verified

Unlock this answer now
Get Access to more Verified Answers free of charge

Related Questions

Q34: If the money wage rate increases, the

Q242: The short-run aggregate supply curve is upward

Q243: <span class="ql-formula" data-value="\begin{array} { | l |

Q244: The government increases taxes. As a result,

Q246: In the United States, during the past

Q247: Suppose the price level rises and the

Q248: <img src="https://d2lvgg3v3hfg70.cloudfront.net/TB6802/.jpg" alt=" -The curve labeled

Q249: When the economy is at an above

Q250: The U.S. aggregate demand curve shifts leftward

Q413: The SAS curve shifts if there is

Examlex

ExamLex

About UsContact UsPerks CenterHomeschoolingTest Prep

Work With Us

Campus RepresentativeInfluencers

Links

FaqPricingChrome Extension

Download The App

Get App StoreGet Google Play

Policies

Privacy PolicyTerms of ServiceHonor CodeCommunity Guidelines

Scan To Download

qr-code

Copyright © (2025) ExamLex LLC.

Privacy PolicyTerms Of ServiceHonor CodeCommunity Guidelines