Multiple Choice
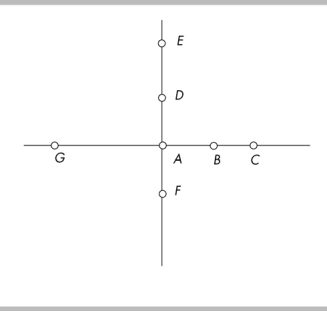
-In the figure above, the value on the x-axis increases as we move from
A) point G to point A.
B) point C to point A.
C) point E to point A.
D) point F to point A.
Correct Answer:

Verified
Correct Answer:
Verified
Related Questions
Q18: What is the difference between microeconomics and
Q102: <span class="ql-formula" data-value="\begin{array} { | l |
Q103: If two points on a line
Q105: When an economist talks of scarcity, the
Q107: If there is a direct relationship between
Q108: If a large change in the variable
Q109: Scarcity is a situation in which .<br>A)
Q110: A graph measures y on the vertical
Q111: The relationship between two variables, x and
Q441: The slope of a straight line increases