Multiple Choice
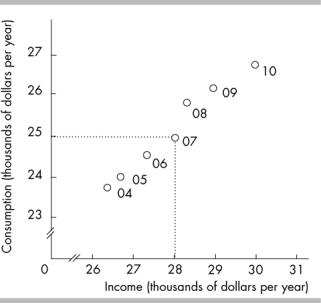
-The above figure plots income and consumption in a nation. In 2007
A) consumption was equal to $25,000 and income was equal to $25,000.
B) consumption was equal to $27,000 and income was equal to $31,000.
C) consumption was equal to $28,000 and income was equal to $25,000.
D) consumption was equal to $25,000 and income was equal to $28,000.
Correct Answer:

Verified
Correct Answer:
Verified
Q265: What is the difference between scarcity and
Q275: Suppose that for a curve, as the
Q277: <img src="https://d2lvgg3v3hfg70.cloudfront.net/TB6802/.jpg" alt=" -In the above,
Q278: Which of the following is a positive
Q279: A curve is plotted with y measured
Q281: Which of the following is a positive
Q282: <span class="ql-formula" data-value="\begin{array} { | l |
Q283: Which of the following is NOT a
Q284: <img src="https://d2lvgg3v3hfg70.cloudfront.net/TB6802/.jpg" alt=" -The relationship depicted
Q285: <img src="https://d2lvgg3v3hfg70.cloudfront.net/TB6802/.jpg" alt=" -The slope in