Multiple Choice
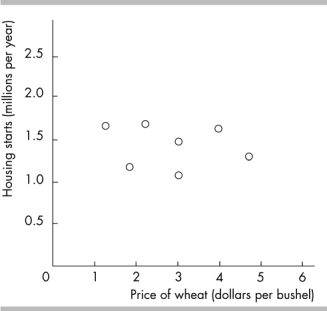
-The above figure graphs the price of a bushel of wheat and housing starts. The graph shows the variables are
A) strongly positively related.
B) related via an indirect relationship.
C) not related.
D) strongly negatively related.
Correct Answer:

Verified
Correct Answer:
Verified
Q202: Explain whether the statement "The government should
Q292: If a curve rises and then falls,
Q293: ʺAs part of the financial crisis bailout
Q294: <span class="ql-formula" data-value="\begin{array} { | l |
Q295: <img src="https://d2lvgg3v3hfg70.cloudfront.net/TB6802/.jpg" alt=" -In the figure
Q296: Which of the following are true regarding
Q298: <img src="https://d2lvgg3v3hfg70.cloudfront.net/TB6802/.jpg" alt=" -The
Q299: Consider the following events:<br>i. Samsung hires associates
Q300: During the summer you have made the
Q301: <img src="https://d2lvgg3v3hfg70.cloudfront.net/TB6802/.jpg" alt=" -The slope of