Multiple Choice
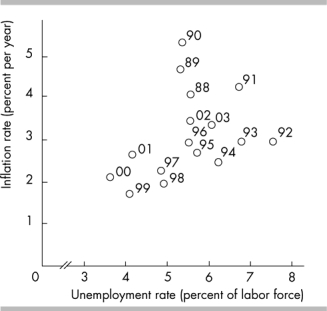
-The figure above shows that in 1996, unemployment was equal to about and the inflation rate was equal to about .
A) 5.5 percent; 3.0 percent
B) 7.0 percent; 3.0 percent
C) 3.0 percent; 5.5 percent
D) 6.0 percent; 4.0 percent
Correct Answer:

Verified
Correct Answer:
Verified
Q257: The horizontal axis in a graph<br>A) is
Q258: <img src="https://d2lvgg3v3hfg70.cloudfront.net/TB6802/.jpg" alt=" -The slope of
Q259: Suppose we are considering the relationship between
Q260: Marginal cost is the<br>A) cost of an
Q261: When a textile company keeps track of
Q263: In economics, normative statements are about<br>A) marginal
Q264: Along a curve, when one variable increases,
Q265: <span class="ql-formula" data-value="\begin{array} { | l |
Q267: Opportunity cost is defined as the<br>A) highest-valued
Q359: To graph a relationship that involves more