Multiple Choice
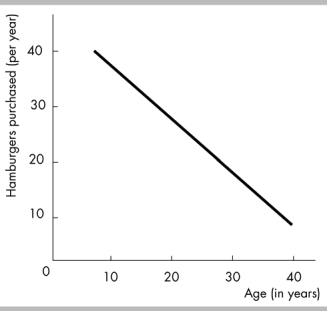
-The above figure depicts a
A) negative non-linear relationship between age and the number of hamburgers purchased per year.
B) positive non-linear relationship between age and the number of hamburgers purchased per year.
C) positive linear relationship between age and the number of hamburgers purchased per year.
D) negative linear relationship between age and the number of hamburgers purchased per year.
Correct Answer:

Verified
Correct Answer:
Verified
Q27: Suppose you plan to go to school
Q188: Scarcity applies to both the rich and
Q339: Which of the following questions is a
Q340: What does the slope of the line
Q342: U.S. producers decide to produce more compact
Q343: <img src="https://d2lvgg3v3hfg70.cloudfront.net/TB6802/.jpg" alt=" -The above figure
Q345: If the marginal cost of an activity
Q346: Ben Bernanke, Chairman of the Federal Reserve,
Q348: Which of the following is a positive
Q349: Entrepreneurs do all of the following EXCEPT<br>A)