Multiple Choice
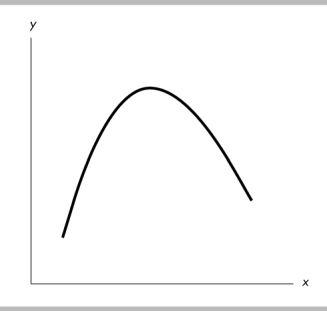
-In the figure above, the relationship between the x variable and the y variable
A) is positive.
B) starts by being positive and then becomes negative.
C) starts by being negative and then becomes positive.
D) is negative.
Correct Answer:

Verified
Correct Answer:
Verified
Q248: <img src="https://d2lvgg3v3hfg70.cloudfront.net/TB6802/.jpg" alt=" -In the above
Q249: As an economic concept, scarcity applies to<br>A)
Q250: <span class="ql-formula" data-value="\begin{array} { | l |
Q251: ʺIt is impossible to represent a three
Q252: Normative statements are statements about<br>A) what ought
Q254: <img src="https://d2lvgg3v3hfg70.cloudfront.net/TB6802/.jpg" alt=" -In the figure
Q255: The variable measured on the y-axis increases
Q256: <img src="https://d2lvgg3v3hfg70.cloudfront.net/TB6802/.jpg" alt=" -In the above
Q257: The horizontal axis in a graph<br>A) is
Q258: <img src="https://d2lvgg3v3hfg70.cloudfront.net/TB6802/.jpg" alt=" -The slope of