Multiple Choice
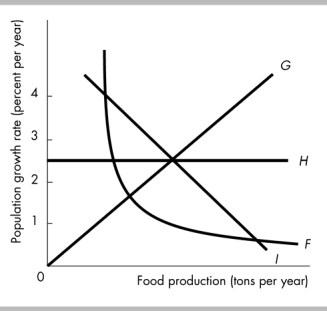
-In the above figure, which curve indicates that the level of food production does not affect the population growth rate?
A) I
B) H
C) F
D) G
Correct Answer:

Verified
Correct Answer:
Verified
Related Questions
Q41: When I buy an $8.00 movie ticket
Q381: Which of the following is an example
Q382: Suppose you produce 10 bikes a day
Q383: <img src="https://d2lvgg3v3hfg70.cloudfront.net/TB6802/.jpg" alt=" -In the above
Q384: ʺAs part of the financial crisis bailout
Q385: <span class="ql-formula" data-value="\begin{array} { | l |
Q388: What does the slope of the line
Q389: One economist says that raising taxes on
Q390: Dell Computers decides to produce PCs and
Q465: A cross-section graph can show how economic