Multiple Choice
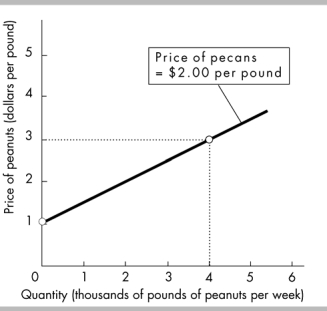
-In the above figure, while drawing the line showing the relationship between the price of a pound of peanuts and the quantity sold, the
A) quantity of peanuts that farmers supply is constant.
B) price of a pound of pecans is held constant.
C) price of a pound of peanuts is held constant.
D) Both answers A and B are true.
Correct Answer:

Verified
Correct Answer:
Verified
Q318: <img src="https://d2lvgg3v3hfg70.cloudfront.net/TB5273/.jpg" alt=" -In the above
Q365: Economics can be defined as the social
Q366: Factors of production include<br>A) land, labor, capital
Q367: Along a straight line, the value of
Q368: Along a straight line, when x equals
Q369: The largest part of what the United
Q371: The graph of two variables, x and
Q373: In economics we learn that<br>A) tradeoffs allow
Q374: Which of the following is an example
Q406: To calculate the slope of a curved