Multiple Choice
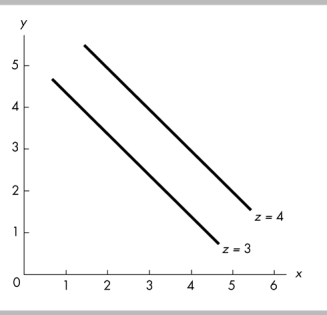
-In the figure above, an increase in z leads to a
A) rightward shift of the line showing the relationship between x and y.
B) leftward shift of the line showing the relationship between x and y.
C) movement down along one of the lines showing the relationship between x and y.
D) movement up along one of the lines showing the relationship between x and y.
Correct Answer:

Verified
Correct Answer:
Verified
Q156: A scatter diagram will be most useful<br>A)
Q158: Human resources that perform the functions of
Q160: <span class="ql-formula" data-value="\begin{array} { | l |
Q162: The study of the choices made by
Q163: <span class="ql-formula" data-value="\begin{array} { | l |
Q164: A linear relationship<br>A) always has a maximum.<br>B)
Q165: Which of the following is a microeconomic
Q166: On Saturday morning, you rank your choices
Q419: Most income in the United States is
Q483: Explain what entrepreneurship is and why it