Essay

-The table above shows how the number of books Katie buys each year depends on her income.
a) What kind of relationship exists between Katieʹs income and the number of books she purchases?
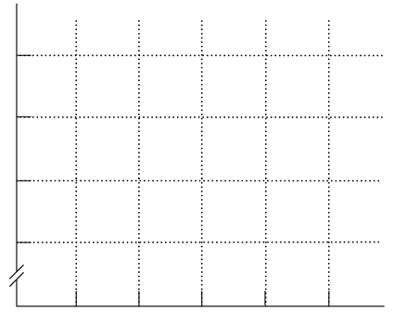
b) Plot the relationship between Katieʹs income and the number of books she purchases in the above figure. Measure income along the vertical axis and the number of books along the horizontal axis. Be sure to label the axes.
c) What is the slope of the relationship between $50,000 and $70,000 of income?
d) What is the slope of the relationship between $90,000 and $110,000 of income?
e) Comment on the similarity or dissimilarity of your answers to parts c) and d).
Correct Answer:

Verified
a) There is a positive relationship. Whe...View Answer
Unlock this answer now
Get Access to more Verified Answers free of charge
Correct Answer:
Verified
View Answer
Unlock this answer now
Get Access to more Verified Answers free of charge
Q240: Whenever one variable increases, another variable decreases.
Q241: Microeconomics is the study of .<br>A) the
Q242: Statements about what ought to be are
Q243: The faster an automobile is driven speed),
Q244: <img src="https://d2lvgg3v3hfg70.cloudfront.net/TB6802/.jpg" alt=" -In the above
Q246: A graph shows the price of a
Q247: The fact that a rock star earns
Q248: <img src="https://d2lvgg3v3hfg70.cloudfront.net/TB6802/.jpg" alt=" -In the above
Q249: As an economic concept, scarcity applies to<br>A)
Q250: <span class="ql-formula" data-value="\begin{array} { | l |