Multiple Choice
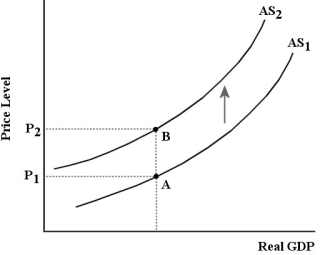 FIGURE 23-2
-Refer to Figure 23-2. The shift from AS1 to AS2 shown in the diagram is referred to as an)
A) increase in aggregate supply.
B) increase in unit costs.
C) negative aggregate supply shock.
D) positive aggregate supply shock.
E) decrease in unit costs.
Correct Answer:

Verified
Correct Answer:
Verified
Q68: Other things being equal,an exogenous increase in
Q89: Consider a simple macro model with a
Q89: A leftward shift in the economy's AS
Q96: The concept of "demand-determined output" requires _
Q99: Consider the simple multiplier when the price
Q103: The economy's aggregate supply (AS)curve shows the
Q108: One of the reasons why the aggregate
Q115: <img src="https://d2lvgg3v3hfg70.cloudfront.net/TB5441/.jpg" alt=" FIGURE 23-2 -Refer
Q124: In building a macro model with an
Q132: The AD curve shows the relationship between<br>A)the