Multiple Choice
The diagram below shows desired aggregate expenditure for a hypothetical economy. Assume the following features of this economy:
· marginal propensity to consume mpc) = 0.75
· net tax rate t) = 0.20
· no foreign trade
· fixed price level
· all expenditure and income figures are in billions of dollars.
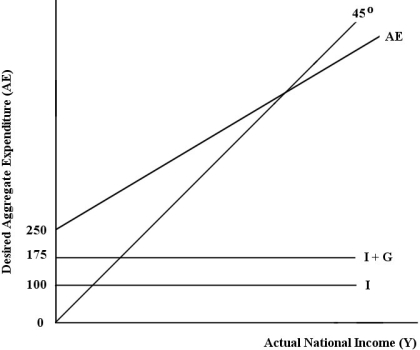 FIGURE 22-2
-Refer to Figure 22-2. Which of the following correctly describes the consumption function for this economy?
A) C = 0.6) YD
B) Y = 250 + 0.75) YD
C) C = 75 + 0.75) YD
D) Y = 250 + 0.75) Y
E) C = 250 + 0.6) Y
Correct Answer:

Verified
Correct Answer:
Verified
Q1: Consider the following news headline: "Business community
Q12: The diagrams below show the import,export,and net
Q37: An upward shift and flattening of the
Q48: Consider a simple macro model with a
Q50: Consider a simple macro model with a
Q91: Consider the government's budget balance.Suppose G =
Q102: <img src="https://d2lvgg3v3hfg70.cloudfront.net/TB5441/.jpg" alt=" FIGURE 22-5 -Refer
Q112: Fiscal policy involves the government's use of
Q127: A parallel upward shift in the net
Q127: Consider a macro model in which output