Multiple Choice
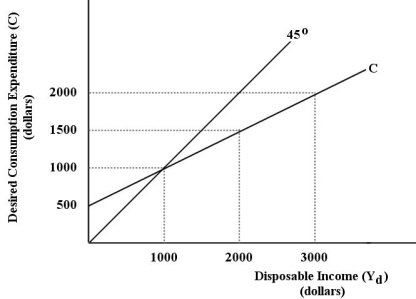 FIGURE 21-2
-Refer to Figure 21-2.What is the marginal propensity to consume associated with this consumption function?
A) 0.5
B) 0.67
C) 1.0
D) -0.5
E) -1.0
Correct Answer:

Verified
Correct Answer:
Verified
Q11: The change in desired consumption divided by
Q16: <img src="https://d2lvgg3v3hfg70.cloudfront.net/TB5441/.jpg" alt=" FIGURE 21-2 -Refer
Q17: The percentage of disposable income that is
Q18: Consider the following news headline: "Increase in
Q23: <img src="https://d2lvgg3v3hfg70.cloudfront.net/TB5441/.jpg" alt=" FIGURE 21-3 -Refer
Q29: When desired consumption exceeds disposable income,desired saving
Q61: Suppose the price level is constant,output is
Q88: Suppose aggregate output is demand-determined.If the simple
Q117: Consider a simple macro model with a
Q120: In a simple model of the economy,without