Multiple Choice
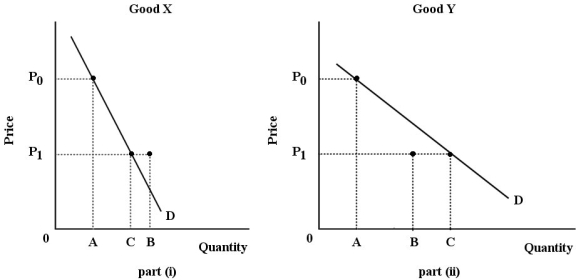 FIGURE 6-4
-Refer to Figure 6-4. For both goods, the price falls from P0 to P1. The substitution effect is illustrated by the change in quantity demanded from A to B; the income effect is illustrated by the change in quantity demanded from B to C. Good Y is certainly an) good.
A) normal
B) inferior
C) luxury
D) necessity
E) Giffen
Correct Answer:

Verified
Correct Answer:
Verified
Q34: The figures below show Chris's consumption of
Q49: The table below shows the total value
Q68: The Smith family is allocating its monthly
Q71: <img src="https://d2lvgg3v3hfg70.cloudfront.net/TB5441/.jpg" alt=" FIGURE 6-2 -Refer
Q83: At a garage sale,Ken purchases a used
Q85: The table below shows the quantities of
Q86: Dave's Consumer Surplus on Movie Rentals per
Q87: For your typical consumption levels of water
Q90: <img src="https://d2lvgg3v3hfg70.cloudfront.net/TB5441/.jpg" alt=" FIGURE 6-1 -Refer
Q123: Dave's Consumer Surplus on Movie Rentals per