Multiple Choice
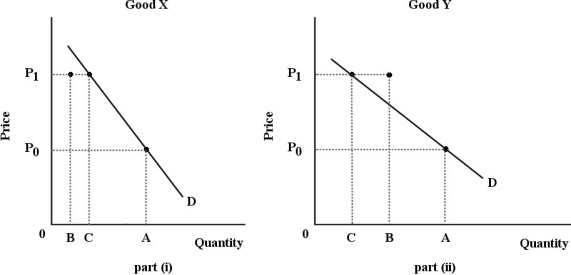 FIGURE 6-5
-Refer to Figure 6-5. For both goods, the price increases from P0 to P1. The substitution effect is illustrated by the change in quantity demanded from A to B; the income effect is illustrated by the change in quantity demanded from B to C. Good X is certainly an) good.
A) normal
B) inferior
C) luxury
D) necessity
E) Giffen
Correct Answer:

Verified
Correct Answer:
Verified
Q16: In indifference curve analysis,the consumer's utility-maximizing point
Q24: Suppose a consumer can purchase only two
Q30: An equal proportional increase in money income
Q37: Laurie spends all of her money buying
Q38: The paradox in "the paradox of value"
Q50: In which of the following situations will
Q72: 6A-4 Deriving the Demand Curve<br>-Refer to Figure
Q99: Assume you are consuming two goods,X and
Q122: Given a typical downward-sloping demand curve in
Q137: The table below shows the total value