Multiple Choice
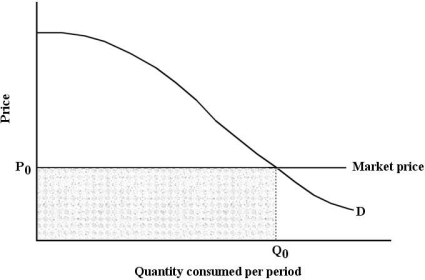 FIGURE 6-7
-Refer to Figure 6-7. Suppose that price is P0. The total value placed on all units of the commodity consumed is given by the area
A) under the demand curve to the left of Q0.
B) under the demand curve to the left of Q0, but above P0.
C) below P0 and to the left of Q0.
D) under the demand curve and above P0.
E) under the demand curve and to the right of Q0.
Correct Answer:

Verified
Correct Answer:
Verified
Q3: If a consumer is faced with a
Q5: The table below shows the total value
Q44: A demand curve for a normal good
Q70: The marginal rate of substitution measures the
Q84: Economists usually assume that consumers<br>A)are motivated to
Q97: Consider the pizza market,with a downward-sloping demand
Q109: Suppose a consumer can purchase only two
Q120: Suppose Arun consumes only 2 goods -
Q135: Since there is a relatively plentiful supply
Q139: Bjorn is a student with a monthly