Multiple Choice
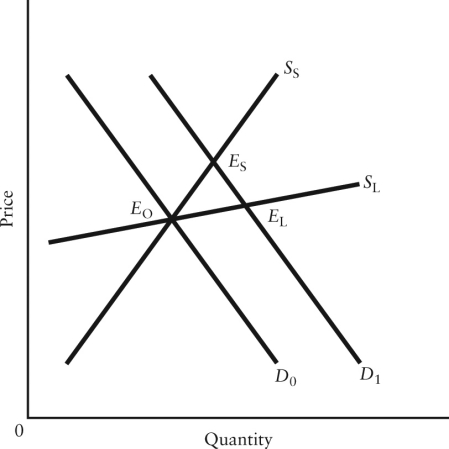
 FIGURE 4-3
-Refer to Figure 4-3. The diagram shows a rightward shift in the demand curve for some good, and the
Short-run and long-run supply curves SS and SL, respectively) . In the new short-run equilibrium after the increase in demand, producersʹ revenue
A) is unambiguously lower than in the long-run equilibrium at EL.
B) could be higher or lower than at E0, depending on the short-run elasticity of supply.
C) is unambiguously higher than at E0.
D) is unambiguously lower than at E0.
E) is unambiguously higher than at EL.
Correct Answer:

Verified
Correct Answer:
Verified
Q51: <img src="https://d2lvgg3v3hfg70.cloudfront.net/TB5441/.jpg" alt=" FIGURE 4-2 -Refer
Q72: The price elasticity of demand for a
Q75: The president of a major nickel-producing company
Q88: If the income elasticity of demand for
Q116: There have been proposals that a tax
Q124: A value of infinity for the elasticity
Q135: We can expect that the income elasticity
Q150: If the income elasticity of demand for
Q152: Producers will bear a larger burden of
Q160: Which of the following situations could explain