Multiple Choice
The table below shows hypothetical data for volumes of e-books and hardcover books sold over a 3-year period in a particular city.
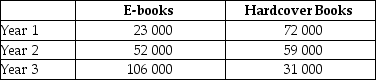 TABLE 2-3
-Refer to Table 2-3.Between Year 1 and Year 3,what is the percentage change in sales of hardcover books?
A) 0.569%
B) 56.9%
C) -56.9%
D) -0.569%
E) -569%
Correct Answer:

Verified
Correct Answer:
Verified
Q10: Negatively related variables change such that as
Q38: Which of the following is a normative
Q77: When considering how a family's level of
Q87: A positive statement is one that states<br>A)what
Q105: An economic model that contains a highly
Q106: The table below shows hypothetical data for
Q108: <img src="https://d2lvgg3v3hfg70.cloudfront.net/TB5441/.jpg" alt=" FIGURE 2-4 -Refer
Q111: The table below shows hypothetical data for
Q112: The table below shows hypothetical per-minute cell
Q126: At the minimum or the maximum of