Multiple Choice
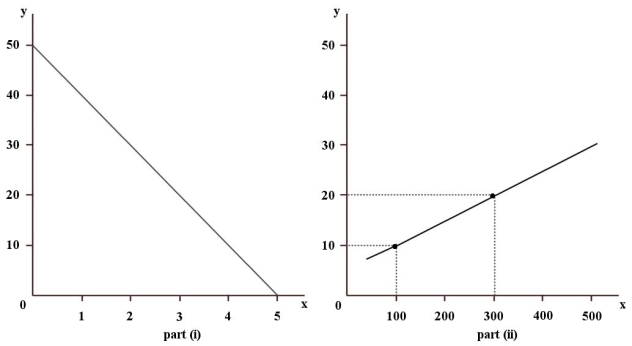 FIGURE 2-1
-Refer to Figure 2-1.What is the slope of the line in part (i) of the figure?
A) -10
B) 5
C) -5
D) -1
E) 1
Correct Answer:

Verified
Correct Answer:
Verified
Related Questions
Q2: Suppose there is a linear relationship between
Q49: The table below shows hypothetical per-minute cell
Q51: The table below shows the approximate value
Q53: <img src="https://d2lvgg3v3hfg70.cloudfront.net/TB5441/.jpg" alt=" FIGURE 2-4 -Refer
Q55: The base year for an index number
Q56: An economist collects data comparing per-capita expenditures
Q57: In a co-ordinate graph,with Y on the
Q64: When it is said that variable A
Q70: The mathematical expression of a relationship between
Q108: The scientific approach to economic inquiry involves<br>A)choosing