Multiple Choice
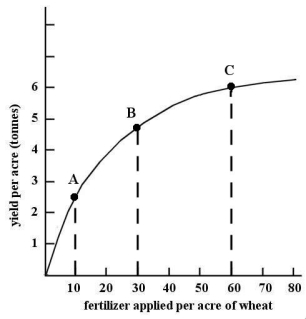 FIGURE 2-4
-Refer to Figure 2-4.The slope of the non-linear function changes as we move along the curve.The slope is
A) positive and increasing,indicating an increasing marginal response.
B) negative and decreasing,indicating a diminishing marginal response.
C) positive and decreasing,indicating a diminishing marginal response.
D) negative and increasing,indicating an increasing marginal response.
E) constant at all points,indicating a constant marginal response.
Correct Answer:

Verified
Correct Answer:
Verified
Q36: Suppose an economist tells you that,on average,people
Q53: Most economists believe that economic analysis _
Q61: Suppose an individual wheat farmer's income is
Q63: The table below shows hypothetical tuition costs
Q65: The table below shows hypothetical per-minute cell
Q71: According to the Bank of Canada's website,Canada's
Q73: Suppose economists at the World Bank develop
Q84: On a coordinate graph with y on
Q95: Suppose there is a theory that several
Q114: Suppose we observe that consumption of electricity