Multiple Choice
Use the figure below to answer the following questions.
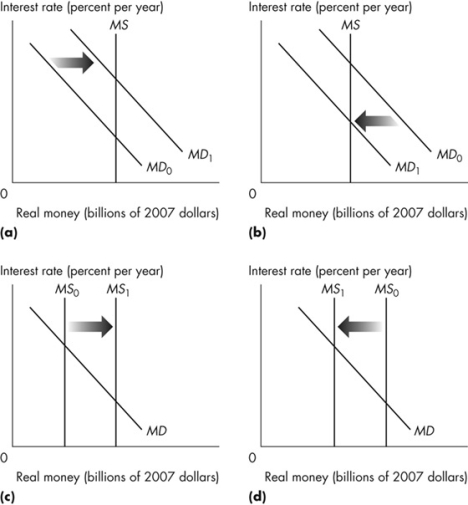 Figure 8.5.1
-Refer to Figure 8.5.1.Everything else remaining the same, which graph best shows the effect of a decrease in real GDP?
A) a
B) b
C) c
D) d
E) a and c
Correct Answer:

Verified
Correct Answer:
Verified
Related Questions
Q51: The higher and more unpredictable the changes
Q52: Barter can only take place if there
Q53: Suppose that the banking system has excess
Q54: The money multiplier will decrease if the
Q55: The higher and more unpredictable the changes
Q57: Money's function as a unit of account
Q58: Suppose that people decide to hold more
Q59: According to the quantity theory of money,
Q60: The equation of exchange in terms of
Q61: During a period of severe inflation, which