Multiple Choice
Use the figure below to answer the following questions.
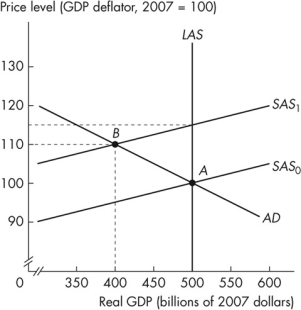 Figure 12.2.2
-Refer to Figure 12.2.2.The economy is in long- run equilibrium.If the short- run aggregate supply curve shifts leftward from SAS0 to SAS1, ceteris paribus, then people expect
A) a real GDP decrease of $50 billion.
B) a 10 percent inflation.
C) the price level to rise to 110.
D) the real wage rate to fall by 10 percent.
E) a 15 percent inflation.
Correct Answer:

Verified
Correct Answer:
Verified
Q95: According to the real business cycle theory,
Q96: Use the figure below to answer the
Q97: The economy starts out at a full-
Q98: The short- run Phillips curve shows the
Q99: Use the table below to answer the
Q100: Use the figure below to answer the
Q101: Use the figure below to answer the
Q103: Use the figure below to answer the
Q104: The key ripple effect in real business
Q105: Use the figure below to answer the