Multiple Choice
Use the figure below to answer the following questions.
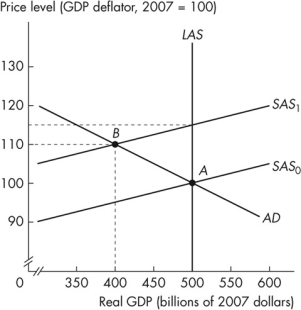 Figure 12.2.2
-Refer to Figure 12.2.2.The vertical distance between SAS0 and SAS1 represents the
A) actual decrease in real GDP.
B) expected decrease in the real wage rate.
C) actual inflation rate.
D) expected increase in real GDP.
E) expected inflation rate.
Correct Answer:

Verified
Correct Answer:
Verified
Q21: Use the figure below to answer the
Q22: Suppose that in response to a decrease
Q23: Suppose aggregate demand increases by more than
Q24: The _ cycle theory states that only
Q25: According to real business cycle theory, workers'
Q27: Which one of the following can start
Q28: An increase in the expected rate of
Q29: Deflation occurs when<br>A)the growth rate of potential
Q30: Use the table below to answer the
Q31: If the unemployment rate rises and the