Multiple Choice
Use the figure below to answer the following questions.
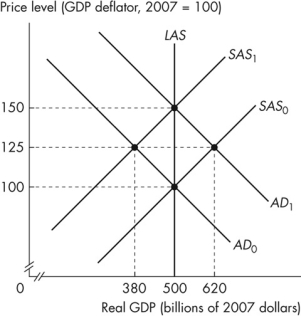 Figure 12.2.3
-Refer to Figure 12.2.3.Assume that the figure illustrates an economy initially in equilibrium at the intersection of the SAS0 curve and the AD0 curve.If the aggregate demand curve is expected to shift to AD1 but remains at AD0, the new equilibrium real GDP is _______ and the new equilibrium price level is _______.
A) $500 billion; 100
B) $380 billion; 100
C) $500 billion; 150
D) $620 billion; 125
E) $380 billion; 125
Correct Answer:

Verified
Correct Answer:
Verified
Q64: Which of the following is not a
Q65: According to real business cycle theory, if
Q66: Cost- push inflation can result from an
Q67: According to real business cycle theory, an
Q68: A movement down along the short- run
Q70: Use the table below to answer the
Q71: Use the figure below to answer the
Q72: Suppose that the money prices of raw
Q73: According to real business cycle theory, a
Q74: The key difference between new classical cycle