Multiple Choice
Use the figure below to answer the following questions.
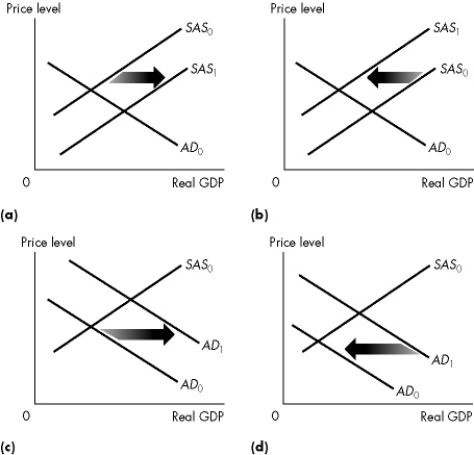 Figure 10.1.1
-Refer to Figure 10.1.1.Which graph illustrates the effect of a decrease in factor prices?
A) a
B) b
C) c
D) d
E) a and b
Correct Answer:

Verified
Correct Answer:
Verified
Related Questions
Q54: Which one of the following newspaper quotations
Q55: Use the table below to answer the
Q56: Full- employment equilibrium occurs when<br>A)all who are
Q57: Autoworkers agree to a cut in the
Q58: Use the figure below to answer the
Q60: Consider an economy starting from a position
Q61: A recessionary gap is the amount by
Q62: Use the figure below to answer the
Q63: Which of the following statements about the
Q64: Canada's exports to the European Union boom.What