Multiple Choice
Use the figure below to answer the following questions.
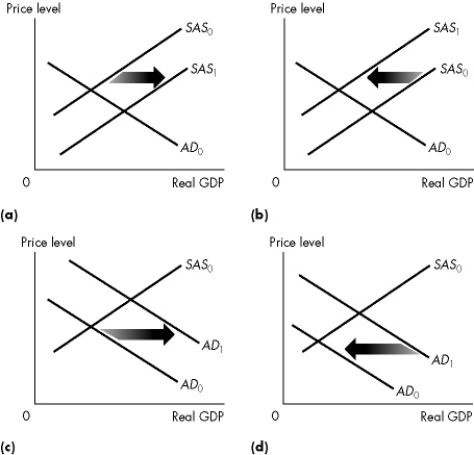 Figure 10.1.1
-Refer to Figure 10.1.1.Which graph illustrates the effect of an increase in factor prices?
A) a
B) b
C) c
D) d
E) a and b
Correct Answer:

Verified
Correct Answer:
Verified
Related Questions
Q92: The economy cannot remain indefinitely with real
Q93: Consider the following events: Event 1: Growth
Q94: Which one of the following is a
Q95: Short- run macroeconomic equilibrium always occurs when
Q96: If factor prices remain constant, an increase
Q98: Use the table below to answer the
Q99: Canadian firms build new pipelines across the
Q100: Toyota and Honda build additional plants in
Q101: The short- run aggregate supply curve indicates<br>A)the
Q102: Which of the following news quotes best