Multiple Choice
Use the figure below to answer the following questions.
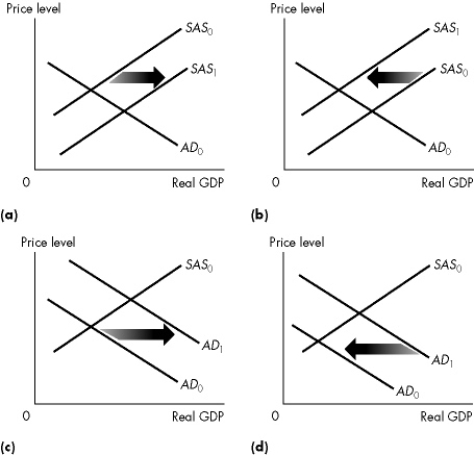 Figure 10.2.1
-Refer to Figure 10.2.1.Which graph illustrates the effect of a decrease in the quantity of money?
A) a only
B) b only
C) c only
D) d only
E) Both b and d
Correct Answer:

Verified
Correct Answer:
Verified
Related Questions
Q14: If the money wage rate falls, then<br>A)the
Q15: Which of the following news quotes best
Q16: Which of the following statements about the
Q17: Use the figure below to answer the
Q18: Use the figure below to answer the
Q20: The Canadian price level rises.What is the
Q21: Use the figure below to answer the
Q22: Use the figure below to answer the
Q23: Which one of the following variables is
Q24: Potential GDP is the level of real