Multiple Choice
Use the figure below to answer the following questions.
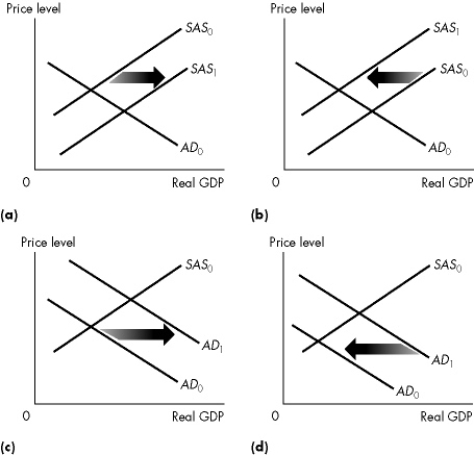 Figure 10.2.1
-Refer to Figure 10.2.1.Which graph illustrates the effect of an increase in expected future income?
A) a only
B) b only
C) c only
D) d only
E) Both a and c
Correct Answer:

Verified
Correct Answer:
Verified
Related Questions
Q116: A _ macroeconomist believes that the economy
Q117: Use the figure below to answer the
Q118: The short- run aggregate supply curve is
Q119: Use the figure below to answer the
Q120: The defining feature of the classical view
Q122: Use the table below to answer the
Q123: Which one of the following variables can
Q124: Keynesian macroeconomists recommend<br>A)policies that actively offset changes
Q125: Which of the following does not change
Q126: An inflationary gap is the amount by