Multiple Choice
Use the figure below to answer the following questions.
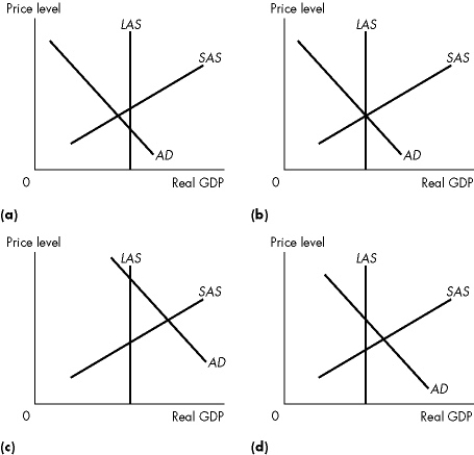 Figure 10.3.3
-Refer to Figure 10.3.3.Which of the graphs illustrates a below full- employment equilibrium?
A) a only
B) b only
C) c only
D) d only
E) both c and d
Correct Answer:

Verified
Correct Answer:
Verified
Related Questions
Q76: The world goes into an expansion.This event<br>A)increases
Q77: Aggregate demand is the relationship between<br>A)the price
Q78: If real GDP is less than potential
Q79: Use the figure below to answer the
Q80: Long- run aggregate supply will increase for
Q82: Economic growth results when there are increases
Q83: Use the table below to answer the
Q84: We observe an increase in the price
Q85: If real GDP is less than potential
Q86: The quantity of real GDP demanded does