Multiple Choice
Use the figure below to answer the following questions.
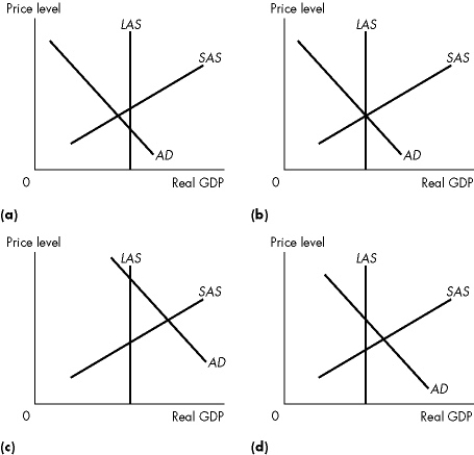 Figure 10.3.3
-Refer to Figure 10.3.3.Which of the graphs illustrates an above full- employment equilibrium?
A) a only
B) b only
C) c only
D) donly
E) both c and d
Correct Answer:

Verified
Correct Answer:
Verified
Related Questions
Q100: Toyota and Honda build additional plants in
Q101: The short- run aggregate supply curve indicates<br>A)the
Q102: Which of the following news quotes best
Q103: Canadian businesses expect future profits to rise.Starting
Q104: An increase in oil prices to a
Q106: Use the figure below to answer the
Q107: Everything else remaining the same, which one
Q108: Which one of the following newspaper quotations
Q109: Which one of the following shifts the
Q110: The Canadian government increases its expenditure on