Multiple Choice
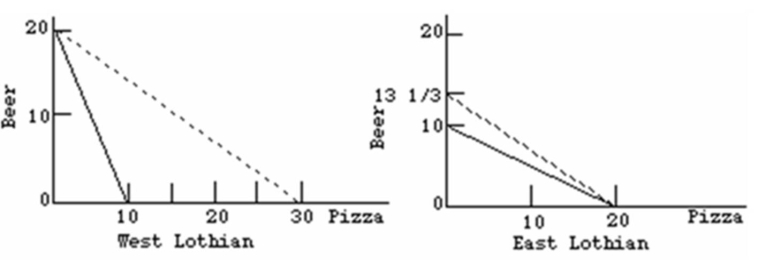 Refer to the above diagrams.The solid lines are production possibilities curves; the dashed lines are trading possibilities curves.The opportunity cost of producing a:
A) pizza is 2 beers in both countries.
B) beer is 1/2 a pizza in both countries.
C) pizza in East Lothian is 1 beer.
D) beer in West Lothian is 1/2 a pizza.
Correct Answer:

Verified
Correct Answer:
Verified
Q32: The increased-domestic-employment argument for tariff protection holds
Q49: The following information is about the cost
Q50: The following data is for the hypothetical
Q51: As it relates to international trade, "dumping":<br>A)is
Q52: The following information is about the cost
Q53: The World Trade Organization advocates new protections
Q56: The major beneficiaries of a tariff on
Q57: Diversification for stability argument is given as
Q58: Which of the following is one of
Q59: The following is the Production possibilities data