Multiple Choice
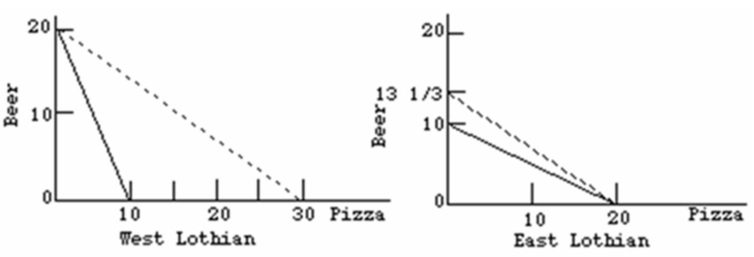 Refer to the above diagrams.The solid lines are production possibilities curves; the dashed lines are trading possibilities curves.The trading possibilities curves imply that:
A) both countries are experiencing an excess of exports over imports which results in economic growth.
B) the domestic production possibilities curves entail unemployment and/or the domestic misallocation of resources.
C) world resources will be allocated more efficiently if the two nations specialize and trade in accordance with comparative advantage.
D) both nations will be worse off as a result of international specialization and trade.
Correct Answer:

Verified
Correct Answer:
Verified
Q70: The following information is about the cost
Q71: Production possibilities data for Gamma and Sigma.All
Q72: <img src="https://d2lvgg3v3hfg70.cloudfront.net/TB6686/.jpg" alt=" Refer to the
Q73: The nation which has a comparative advantage
Q74: A licensing requirement, or unreasonable standard pertaining
Q77: The following table is domestic supply and
Q78: Which is an example of a nontariff
Q80: Other things equal, a tariff is:<br>A)superior to
Q84: An example of a nontariff barrier would
Q140: Which is a valid counter-argument to the