Multiple Choice
The graph below shows the production possibility curves for two hypothetical nations, Orin and Pohl, which each make two hypothetical products, jaxs and keps.Which of the following statements is correct? 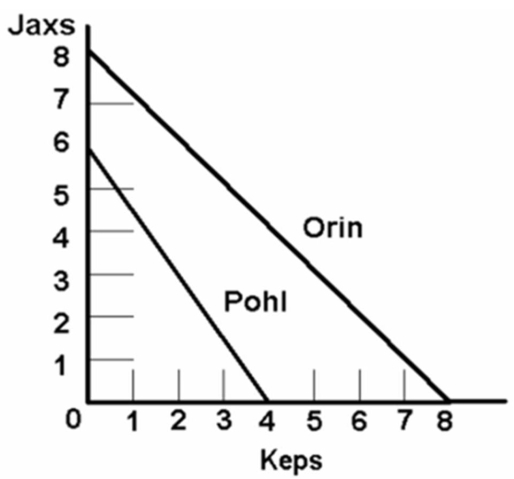
A) Orin has a comparative advantage in both jaxs and keps.
B) Pohl has a comparative advantage in jaxs.
C) The opportunity cost of making jaxs is lower in Orin than in Pohl.
D) Orin is more efficient than Pohl.
Correct Answer:

Verified
Correct Answer:
Verified
Q42: If a nation has a comparative advantage
Q176: The following table is domestic supply and
Q177: <img src="https://d2lvgg3v3hfg70.cloudfront.net/TB6686/.jpg" alt=" Refer to the
Q178: The terms of trade reflects the:<br>A)rate at
Q179: A nation's export supply curve for a
Q182: Assume that by devoting all its resources
Q183: <img src="https://d2lvgg3v3hfg70.cloudfront.net/TB6686/.jpg" alt=" Refer to the
Q184: According to the principle of comparative advantage,
Q186: The World Trade Organization was established by
Q220: International trade based on the principle of