Multiple Choice
The data embodied in the below diagrams suggest that: 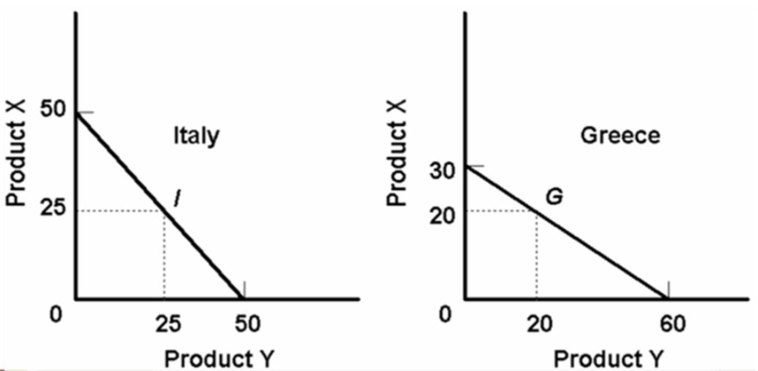
A) Italy should export X and Greece should export Y.
B) Greece should export X and Italy should export Y.
C) production in both countries is subject to increasing costs.
D) Italy should import both X and Y from Greece.
Correct Answer:

Verified
Correct Answer:
Verified
Q1: Differences in production efficiencies among nations in
Q2: <img src="https://d2lvgg3v3hfg70.cloudfront.net/TB6686/.jpg" alt=" Refer to the
Q4: The law of increasing opportunity costs:<br>A)applies to
Q5: <img src="https://d2lvgg3v3hfg70.cloudfront.net/TB6686/.jpg" alt=" Refer to the
Q6: Export supply curves are _ import demand
Q7: Which of the following was the most
Q8: The following data is for the hypothetical
Q9: Assume that by devoting all its resources
Q11: The following data is for the hypothetical
Q124: In effect, tariffs on imports are<br>A) special