Multiple Choice
Refer to the diagram below in which line AB is Canadian production possibility curve and AC is its trading possibilities curve.The international exchange ratio between beef and cheese (terms of trade) : 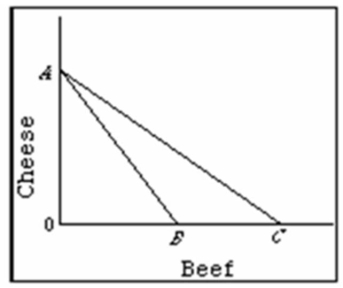
A) is the absolute value of slope of line AB.
B) is the absolute value of slope of line AC.
C) could lie anywhere between the absolute value of the slopes of lines AB and AC.
D) cannot be determined on the basis of this information.
Correct Answer:

Verified
Correct Answer:
Verified
Q39: The 1993 General Agreement on Tariffs and
Q40: Since World War II, several factors have
Q41: The following data is for the hypothetical
Q42: Production possibilities data for Gamma and Sigma.All
Q43: In comparing a tariff and an import
Q45: <img src="https://d2lvgg3v3hfg70.cloudfront.net/TB6686/.jpg" alt=" Refer to the
Q46: The following data is for the hypothetical
Q47: Which is a valid counterargument to the
Q48: Which products were the leading imports of
Q49: The following information is about the cost