Multiple Choice
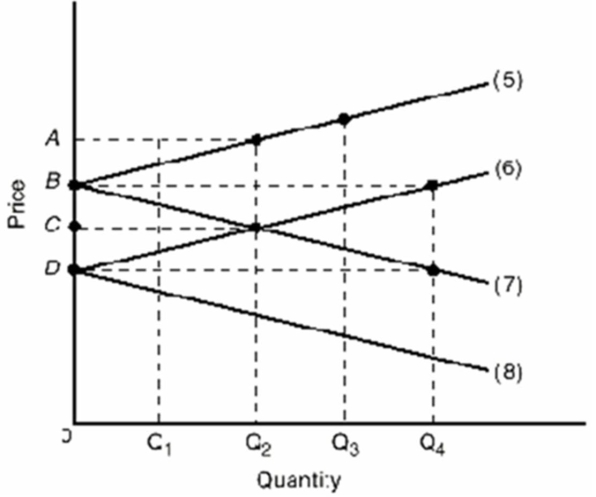 Refer to the above graph which shows the import demand and export supply curves for two nations that produce a product.The import demand curves for the two nations are represented by lines:
A) 5 and 6.
B) 5 and 7.
C) 6 and 8.
D) 7 and 8.
Correct Answer:

Verified
Correct Answer:
Verified
Q136: The data in the tables below, show
Q137: <img src="https://d2lvgg3v3hfg70.cloudfront.net/TB6686/.jpg" alt=" Refer to the
Q138: Which country did Canada sign a free-trade
Q139: Studies show that:<br>A)it is impossible to estimate
Q140: Refer to the diagrams below.Which of the
Q143: The statement that "tariffs are needed to
Q145: Comparative advantage can result from different climates,
Q146: Refer to the diagram below in which,
Q174: The law of increasing opportunity costs limits
Q288: Country A limits other nation's exports to