Multiple Choice
Refer to the graphs below.The first graph shows the money market of an economy, and the second graph shows the market for goods and services in the economy. 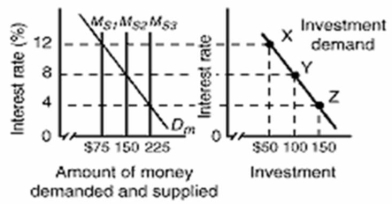
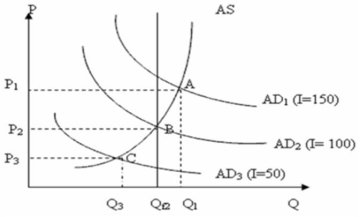 In the above diagrams, the numbers in the parentheses after the AD1, AD2, and AD3 labels indicate the levels of investment spending associated with each AD curve.All figures are in billions.Qf is the full-employment level of real output.Suppose the economy is in equilibrium at point C on the aggregate demand curve.Which of the following should the monetary authorities pursue to achieve a non-inflationary full-employment level of real GDP?
A) They should increase the money supply from $75 billion to $150 billion.
B) They should increase the money supply from $150 billion to $225 billion.
C) They should decrease the money supply from $225 billion to $50 billion.
D) They should decrease interest rates from 12 percent to 4 percent.
Correct Answer:

Verified
Correct Answer:
Verified
Q53: In the consolidated balance sheet of the
Q54: Refer to the graph given below. <img
Q55: <img src="https://d2lvgg3v3hfg70.cloudfront.net/TB6686/.jpg" alt=" Refer to the
Q56: An expansionary monetary policy that is used
Q58: Which of the following is correct? When
Q59: The economy is experiencing high unemployment and
Q60: The most important day-to-day monetary instrument that
Q61: The equilibrium rate of interest in the
Q62: The impact of monetary policy upon investment
Q222: The total demand for money will shift