Multiple Choice
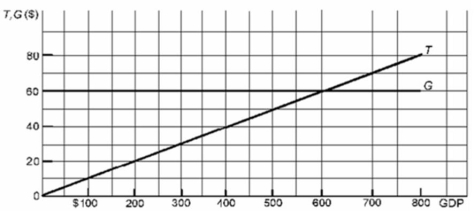 Refer to the above diagram where T is tax revenues and G is government expenditures.All figures are in billions of dollars.If the full-employment GDP is $400 billion while the actual GDP is $200 billion, the cyclical deficit is:
A) $40 billion.
B) $20 billion.
C) zero.
D) $60 billion.
Correct Answer:

Verified
Correct Answer:
Verified
Q90: Which of the following phases of a
Q91: An example of a built-in automatic stabilizer
Q92: The crowding-out effect arises when:<br>A)government borrows in
Q93: The Federal budget deficit is calculated each
Q94: Which one of the following might offset
Q96: Suppose that in an economy with a
Q97: Assume the economy is in the midst
Q98: A cyclical surplus (movement from a deficit
Q99: In an aggregate demand and aggregate supply
Q100: Economists refer to a budget deficit which