Multiple Choice
 Lines A and B in the above graph represent:
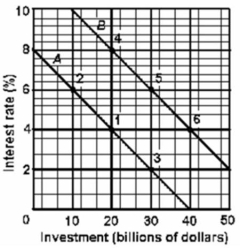
A) the crowding-out effect.
B) the interest-rate effect.
C) investment demand curves.
D) money demand curves.
Correct Answer:

Verified
Correct Answer:
Verified
Related Questions
Q5: Refer to the graph given below. <img
Q7: Which are contractionary fiscal policies?<br>A)increased taxation and
Q8: Which combination of fiscal policy actions would
Q11: A cyclically adjusted budget deficit is also
Q12: The "political business cycle" refers to the
Q13: Which policy to finance the public debt
Q14: The lag between the time the need
Q15: A public debt which is owed to
Q88: The financing of a government deficit increases
Q118: Which of the following statements is correct?<br>A)The