Multiple Choice
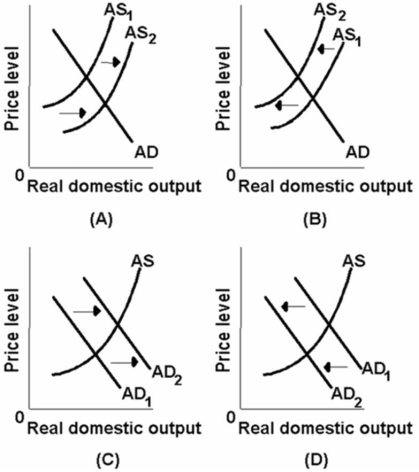 Which of the above diagrams best portrays the effects of an increase in productivity?
A) A
B) B
C) C
D) D
Correct Answer:

Verified
Correct Answer:
Verified
Related Questions
Q55: The aggregate supply curve slopes downward.
Q56: The long run aggregate supply:<br>A)is downward sloping.<br>B)is
Q57: The following table gives information about the
Q58: The real-balances, interest rate, and foreign trade
Q59: Which one of the following would increase
Q61: We would expect a decline in personal
Q62: The following table gives information about the
Q63: The following table is for a particular
Q64: Which of the factors below best explain
Q65: The factors which affect the amounts that