Multiple Choice
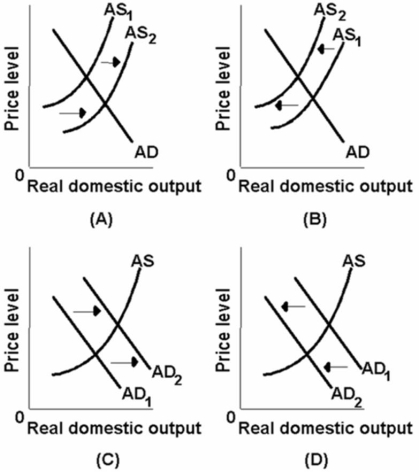 Which of the above diagrams best portrays the effects of declines in the prices of imported resources?
A) A
B) B
C) C
D) D
Correct Answer:

Verified
Correct Answer:
Verified
Related Questions
Q92: The following aggregate demand and supply schedules
Q93: Other things equal, if world oil prices
Q94: Cost-push inflation arises from:<br>A)a decrease in aggregate
Q95: Other things equal, an increase in productivity
Q96: Income and substitution effects what portions, if
Q99: When the excess capacity of business rises,
Q101: A decrease in interest rates caused by
Q102: Refer to the diagram given below. <img
Q137: Productivity measures<br>A) real output per unit of
Q184: An increase in aggregate expenditures resulting from