Multiple Choice
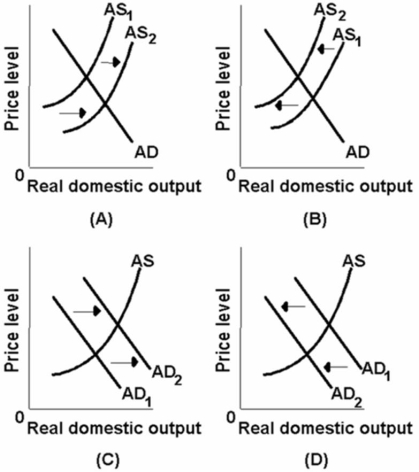 Which of the above diagrams best portrays the effects of a dramatic increase in energy prices?
A) A
B) B
C) C
D) D
Correct Answer:

Verified
Correct Answer:
Verified
Q69: <img src="https://d2lvgg3v3hfg70.cloudfront.net/TB6686/.jpg" alt=" Refer to the
Q70: The interest-rate and real-balances effects are important
Q71: Refer to the diagram given below. <img
Q72: Refer to the diagram below. <img src="https://d2lvgg3v3hfg70.cloudfront.net/TB6686/.jpg"
Q73: Refer to the diagram below. <img src="https://d2lvgg3v3hfg70.cloudfront.net/TB6686/.jpg"
Q75: Shifts in the aggregate supply curve are
Q76: An increase in investment spending can be
Q77: In which of the following sets of
Q78: The interest rate effect indicates that a(n):<br>A)decrease
Q79: The foreign trade effect:<br>A)shifts the aggregate demand