Multiple Choice
Refer to the diagram given below. 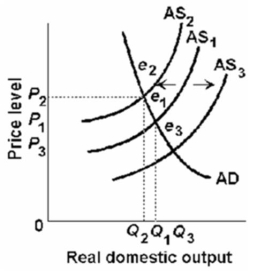 Cost-push inflation can be illustrated by a:
A) shift of the aggregate supply curve from AS1 to AS2.
B) shift of the aggregate supply curve from AS1 to AS3.
C) shift of the aggregate supply curve from AS2 to AS3.
D) movement along the aggregate demand curve from e1 to e3.
Correct Answer:

Verified
Correct Answer:
Verified
Q76: An increase in investment spending can be
Q77: In which of the following sets of
Q78: The interest rate effect indicates that a(n):<br>A)decrease
Q79: The foreign trade effect:<br>A)shifts the aggregate demand
Q80: Refer to the figure given below. <img
Q82: Refer to the diagram below.If the initial
Q84: An increase in household borrowing for consumption
Q85: Which of the following is incorrect?<br>A)As the
Q86: <img src="https://d2lvgg3v3hfg70.cloudfront.net/TB6686/.jpg" alt=" Which of the
Q262: The aggregate expenditures model and the aggregate