Multiple Choice
Refer to the diagram given below. 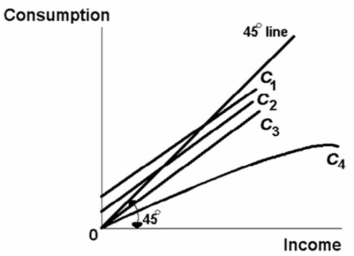 The diagram given above shows consumption schedules.As income rises, the marginal propensity to consume remains constant for:
A) none of the consumption schedules.
B) only C3.
C) only C1, C2, and C3.
D) only C4.
Correct Answer:

Verified
Correct Answer:
Verified
Q120: An upward shift of the saving schedule
Q125: The slope of the consumption schedule is
Q127: The saving schedule is drawn on the
Q181: The investment demand curve of an economy
Q182: If the MPC is .8 and the
Q184: The average propensity to consume can be
Q188: Which one of the following will cause
Q189: Suppose an economy's consumption schedule shifts from
Q190: The department of finance estimates that the
Q191: <img src="https://d2lvgg3v3hfg70.cloudfront.net/TB6686/.jpg" alt=" The above figure