Multiple Choice
Assume that for the entire business sector of a private closed economy there is $0 worth of investment projects which will yield an expected rate of return of 25 percent or more.But there are $15 worth of investments which will yield an expected rate of return of 20-25 percent; another $15 with an expected rate of return of 15-20 percent; and similarly an additional $15 of investment projects in each successive rate of return range down to and including the 0-5 percent range. 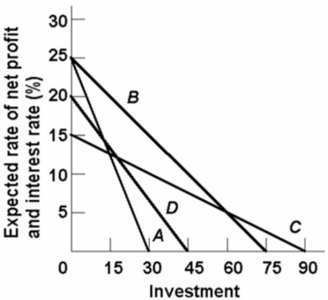 Which of the lines on the above diagram represents these data?
A) A
B) B
C) C
D) D
Correct Answer:

Verified
Correct Answer:
Verified
Q17: If the consumption schedule shifts upward and
Q22: The numerical value of the multiplier will
Q23: Suppose a family's consumption exceeds its disposable
Q90: If a consumption schedule shifts upward, this
Q91: <img src="https://d2lvgg3v3hfg70.cloudfront.net/TB6686/.jpg" alt=" The above table
Q92: The following table illustrates the multiplier process
Q93: <img src="https://d2lvgg3v3hfg70.cloudfront.net/TB6686/.jpg" alt=" Refer to the
Q96: Assume there are no prospective investment projects
Q99: As aggregate income decreases, the APC:<br>A)and APS
Q100: The 45-degree line on a chart relating