Multiple Choice
Refer to the graph given below. 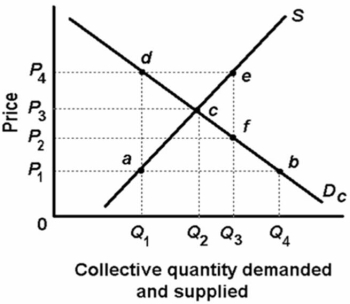 The graph above shows the supply of and the demand for a public good.Which of the following statements is correct?
A) The supply curve reflects the marginal cost of producing each unit of the good, and the demand curve reflects the marginal benefit of consuming each unit of the good.
B) The demand curve reflects the marginal cost of producing each unit of the good, and the supply curve reflects the marginal benefit of consuming each unit of the good.
C) There will be an overallocation of resources at output level Q1.
D) There will be an underallocation of resources at output level Q3.
Correct Answer:

Verified
Correct Answer:
Verified
Q86: The production of economically desirable public goods
Q87: Which one of the following might shift
Q88: Negative externalities are likely to cause:<br>A)underproduction of
Q89: When the full willingness to pay for
Q90: The following data are for a series
Q92: The term "allocative efficiency" refers to:<br>A)the production
Q93: Refer to the diagram.The area of consumer
Q94: Refer to the diagram.The area of producer
Q95: If there are external benefits or positive
Q96: Which of the following is a characteristic